Introduction
Instability in application builds is a common and significant problem in application development. The intermittent failure of tests, whether due to genuine issues with the application under test, the test environment or through issues with the tests themselves can lead major losses of productivity in development teams.
In this post I show how using the power of cloud computing and machine learning anomaly detection algorithms can be used to vastly reduce the amount of time spent debugging application instabilities and to increase confidence in the CI/CD process.
Problem Motivation
Modern applications, particularly those written using a microservices architecture, are highly interconnected and rely on the timely and accurate response of APIs and other resources.
The advance of automated testing techniques and the proliferation of browsers and devices mean that to be confident of a consistent excellent user experience large testing frameworks are commonly run using robotised browsers using drivers such as selenium, interacting with web UIs or with APIs. Common testing frameworks that undertake the task of user acceptance testing include for example Cucumber, which implements the Behaviour Driven Development paradigm.
Although such testing frameworks have enormous positives they also suffer form significant problems:
- They tend to slow to run
- They tend to be brittle
- They may suffer from intermmittent failure
It is the last point that concerns us here. Intermittent failure, something called the flickering scenario problem in BDD testing, can result from an issue with the application under test, a poor testing environment or limitations of the tests themselves.
In most builds each test is only run once for each necessary permutation (browser, device, and so on) rather than multiple times. When a test fails you can never be quite sure how severe that failure is. Therefore, classically CI/CD had a zero tolerance failure to test failures: if one test failed, then so did the build.
These days some CI/CD pipelines allow for a percentage of failure, but this is still a crude approach. The upshot is that if tests have known issues with intermittent failure then the grave danger is that those failures - and the build itself - just become ignored.
Let's Play Whack-a-mole!
Let us say you have just started creating your application and have a small suite of BDD cucumber tests one of which fails 1% of the time. This may not seem like such a big deal: it is a nuisance but a manageable one, and you may well be tempted to ignore it as the build is usually just fine. Developer productivity is not adversely affected. Off you go adding more functionality to your application and of course, more tests.
In time you have several hundreds of tests, and more of them have a small problem with intermittent failure.
Now you have a big problem. Although each test may have a small probability of failing, the probability that at least one test will fail is now high. The probability that the build will pass is a function of the conditional probability. Namely, if the first test passes 99 / 100 times, then the next test must pass, and so on.
P(Test 1| Test 2| Test 3......etc)
If you have 100 tests each with a 1% chance of failure. Then the conditional probability of all tests passing is just 0.36.
P(Test 1| Test 2| Test 3......Test 100) = P(0.99 | 0.99 | 0.99....0.99) = 0.36.
In other words, your build will now fail almost two thirds of time!
You now have no choice but to fix the tests - but it too late.....
"Fixing these tests is like playing whack a mole", a frustrated dev once told me. "No sooner have you done one than another one crops up."
Intermittent test failures can be exceptionally difficult to debug and, especially if the failures are relatively rare, difficult to prioritise. Often, it looks like you have fixed the issue only for the same intermittent failure to resurface later.
Clearly, playing whack-a-mole with the test suite is a hugely frustrating experience, and has severe implications for the dynamics of your team.....
The Build Is Now Unusable..and Your Team Is Disintegrating
- CI/CD is now severely compromised.
A large suite of BDD tests may take hours to run, the developers have code to deploy and re-running the build or even part of it is severely slowing down your CI feedback loop.
2. Demoralised Devs
Anyone who has been in a development team knows how quickly developers switch off from maintaining builds when they no longer have faith that the build state accurately reflects that of the application they are developing.
As already noted, hunting down intermittent failures is extremely costly and frustrating for developers who have far better things to do with their limited time.
Not unnaturally the devs start to complain about the CI/CD process and DevOps, and particularly SDETs, are in the firing line.
3. Silo'd SDETs and distanced DevOps.
If your team employs specialist SDET's and the test framework itself is suspected as being the source of instability, it will almost certainly fall to them to fix matters.
Alternatively, if the major causes of instabilities are blamed on the test environment then it will fall on the shoulders of DevOps. In either case, personnel that should be working closely with the developers in a properly operating AGILE, WebOps culture will start to become Janus-faced:

The culture and ultimately productivity of your team is now falling, as SDETs and/or DevOps do two jobs badly, rather than concentrating on pairing with developers in the sprint on new work.
Stripped Out Tests
If the build can not be fixed quickly, then the developers especially will start to campaign to stop running the offending tests or stripping them out, creating holes in the coverage, and in the case of BDD tests, losing vital Living Documentation of business process. Not unnaturally, testers will tend to take a different view and will fight to retain the test framework.
Loss of Trust and Respect
Ultimately, all this will lead to a fracturing of team relationships, especially between developers and testers. The loss of trust can be severe and not easily restored.

Not only do you know have a useless CI/CD process, you now have a destroyed team
The Solution: A Probabilistic Approach to Build Integrity

Let us return to our scenario where we have a build that runs a test framework containing 100 BDD tests, each with a 1% chance of failure.
Even if the ultimate source of instability is the application itself, we may take the view that a low level of instability will not severely impact user experience and that the build should pass, at least until we have more time to fix the issue. Alternatively, we may find this too high a rate of error but would be happy with a reduced rate of failure, say to 0.5% - i.e. if an aspect of the application fails to work 1/200 times.
The problem remains that we must be absolutely confident that the level instability within the build remains within our defined parameters for acceptance, and that individual test failures do not signify a major degradation in application stability. There is no way we can know this if we run every test permutation just once, or even a small number of times.
Enter Kubernetes

But how about if we could run our test framework not just once but hundreds of times within a few minutes, and collect the output data and store it in an external location?
We should be able to crunch the report data and derive some robust probabilities of test failure, giving us genuine, quantitative insight into the stability or otherwise of the application and its tests.
Specifically:
- We can find the probability of failure for eact test or step within a test.
- We can accurately prioritise what instabilities to fix based on their probabilities of failure.
- We can track patterns of instability over time, thereby setting meaningful goals and improvement metrics to report back to the business.
- We can use sophisticated machine learning algorithms such as Anomaly Detection for detecting changes in build stability, helping us to assess whether a build should be passed or failed.
- We can set metrics for mimimum build stability upon which a build is passed or failed.
Therefore:
- We will have much greater confidence in the build, and tests are much less likely to require deletion.
- Team morale and productivity will be greatly boosted.
Kubernetes, a workload management tool for running containerised applications, allows us to do just that. Using Kubernetes it is possible to replicate your application components hundreds or even thousands of times in a cloud-based cluster environment, place the interfaces to your application replicas behind sophisticated service layers as well as collect output to persistent volumes outside the application containers.
Proof Of Concept
In order to prove the applicability of this approach, I created a number of dockerised applications in NodeJS using the express framework.
- A simple Node Express API that will return random failures ( status 500) based on a variable passed as part of a GET call. For example, passing a value in of 10 will mean that the API returns a failed response 1 / 10 times. This mimics an application containing various unstable API's.
- A standard chrom-selenium docker image
- Simple Cucumber-JS BDD tests that interrogate the API via chrome and selenium, designed to fail randomly with different probabilities of failure. The framework writes the reports to storage using the standard cucumber JSON format with some slight modifications.
- A 'reaping' application, designed to move the test framework JSON reports to a permanent NoSQL datastore (MongoDB) outside of the kubernetes cluster.
- A dashboard and modelling application, that processes all the raw test data and calculates probabilities of failure for each BDD scenario and step. Statstics are visualised using D3.js and the patterns of probability can be analysed using Machine Leaning anomaly detection techniques.
The BDD Test Framework
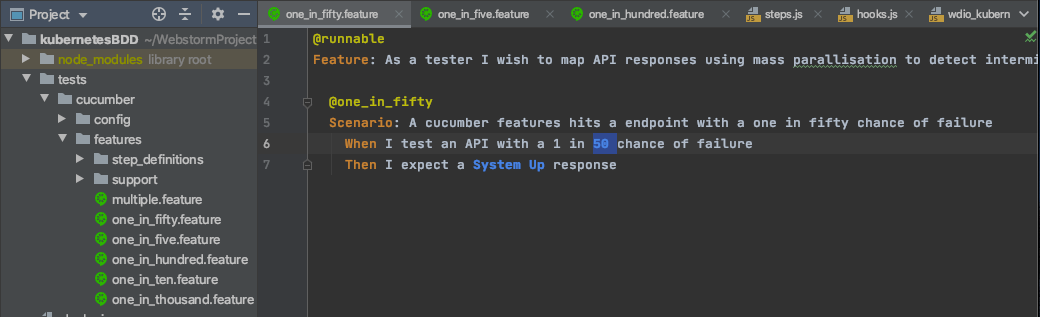
The test framework consists of a number of very simple scenarios, with a 'When' step hitting the API in each case. In each case a different number is supplied to the API and therefore we expect different rates of failure for each of our tests: 1 in 5, 1 in 10, 1 in 50; 1 in 100 and 1 in 1000. The 'Then' step will assert the status response.
Finally a more complicated scenario hits the API multiple times with many different probabilities. We would therefore expect this scenario to fail more often than the others.
Kubernetes Architecture
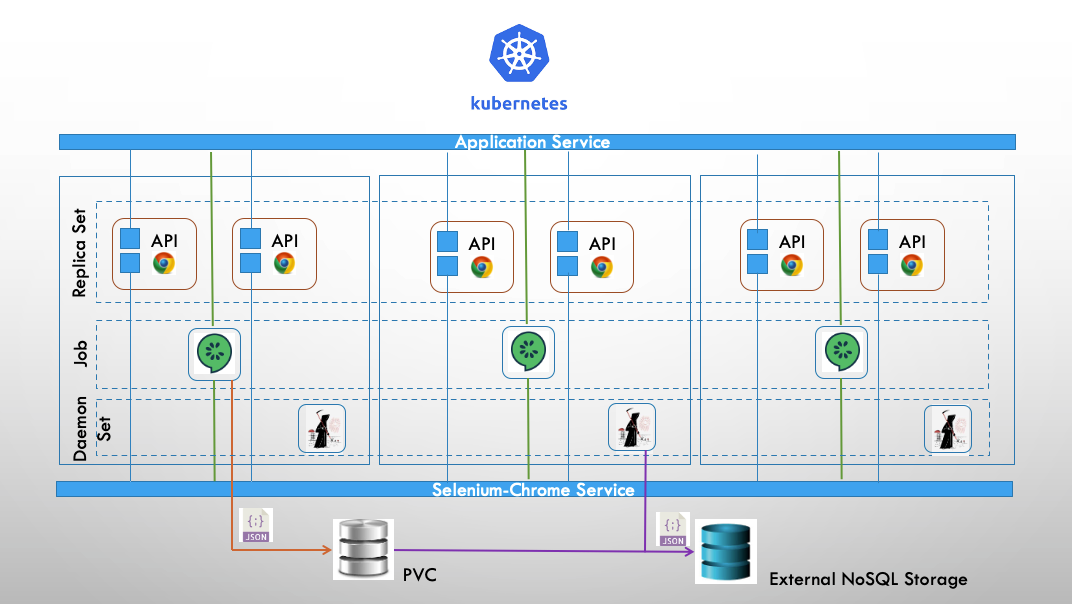
Having dockerised our applications and uploaded the images to a repository service such as docker hub or Quay.io, we can now construct a kubernetes architecture to run our application and test framework.
The salient points are:
- A replica set consisting of 100 pods with containers of the node.js express API (our unstable application) and our chrome selennium driver.
- A load balancing application service that routes incoming requests to one of the API containers within the replica set.
- A chrome-selenium service that routes requests to selenium and chrome driver.
- A kubernetes job. The job consists of 250 pods, each containing a single container that runs the BDD test framework. The job will finish once the test framework has been run 250 times.
- A Persistent Volume Claim, for storing the test framework as JSON files.
- A daemon set of the 'reaper program'. Once the job running the test framework has been completed. A daemon set of the reaper program transfers the JSON files to an external NSQL database outside our cluster.
- An external NoSQL database for permanent storage of our raw JSON test data, in this case MongoDB.
Modelling Workflow 1: Heuristics
Now we have our raw report data safely stored externally we can tear down our Kubernetes cluster if necessary and process the data to calculate the probability of failure for each of our tests.
We do this through our dashboard and modelling application, written in NodeJS and using d3,js for visualisation.
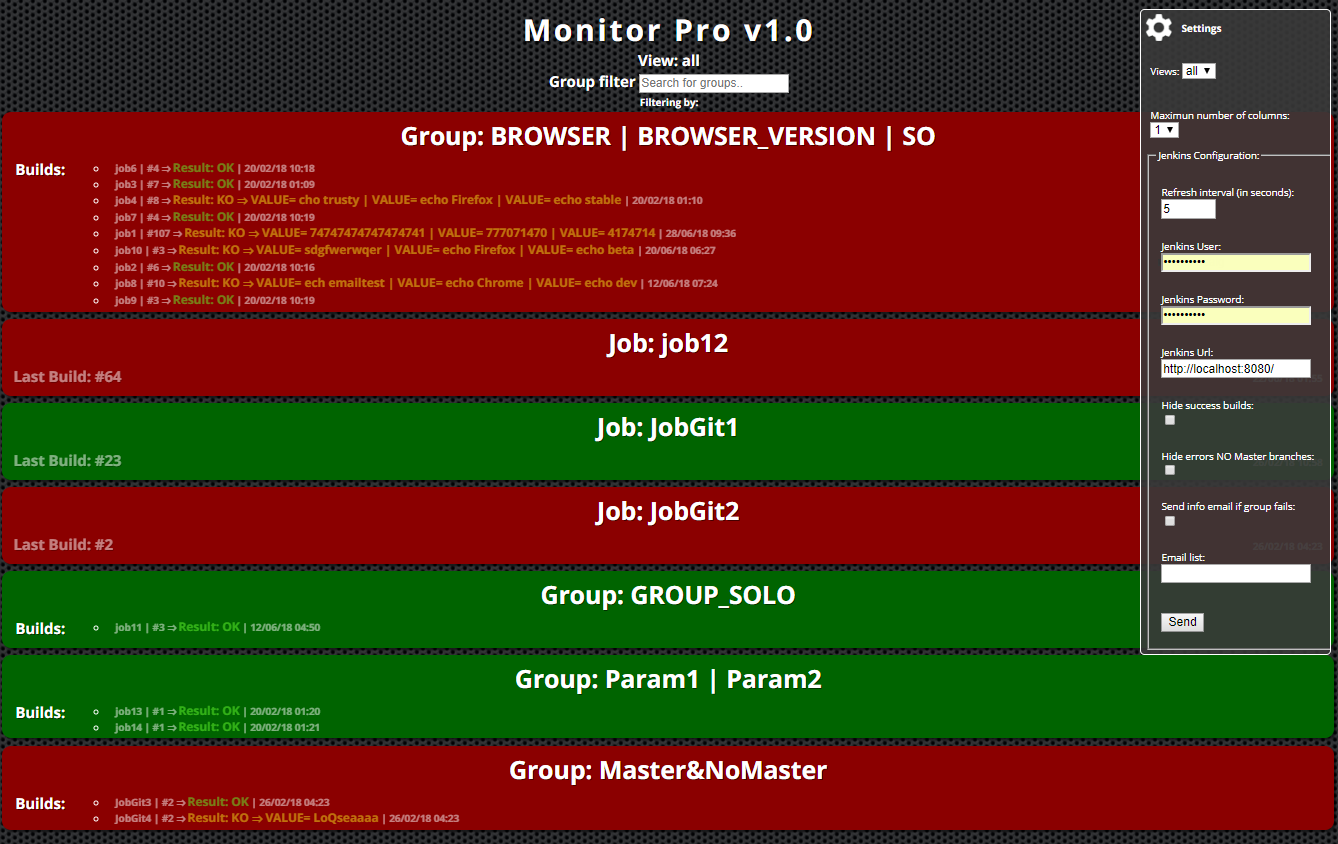
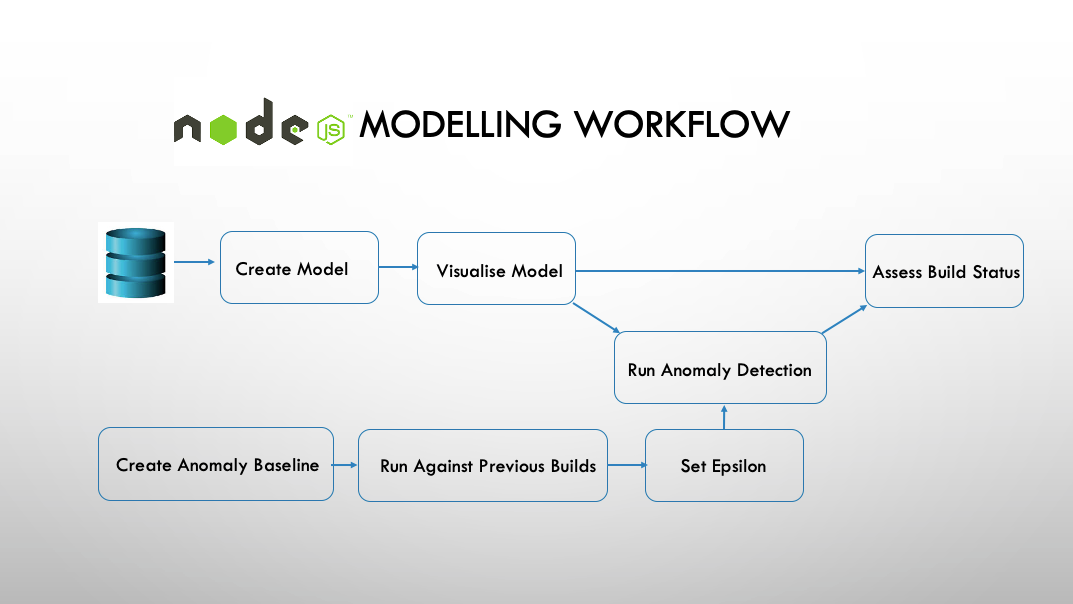
The modelling workflow and a screenshot of the dashboard are shown the diagrams below:
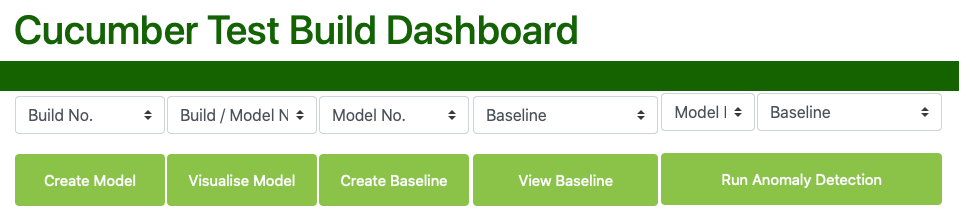

Create Model - pulls down the data from the NoSQL database and runs an mongodb aggregation pipeline upon it. A model is created containing the probabilities of each BDD scenario and each step within a scenario of failure. This model is cached locally and also uploaded back to mongoDB in a different models collections.
Visualise Model - once the model has been created we can visualise it on our dashboard. Visualising the model has a lot of component parts, and screenshots are supplied below.
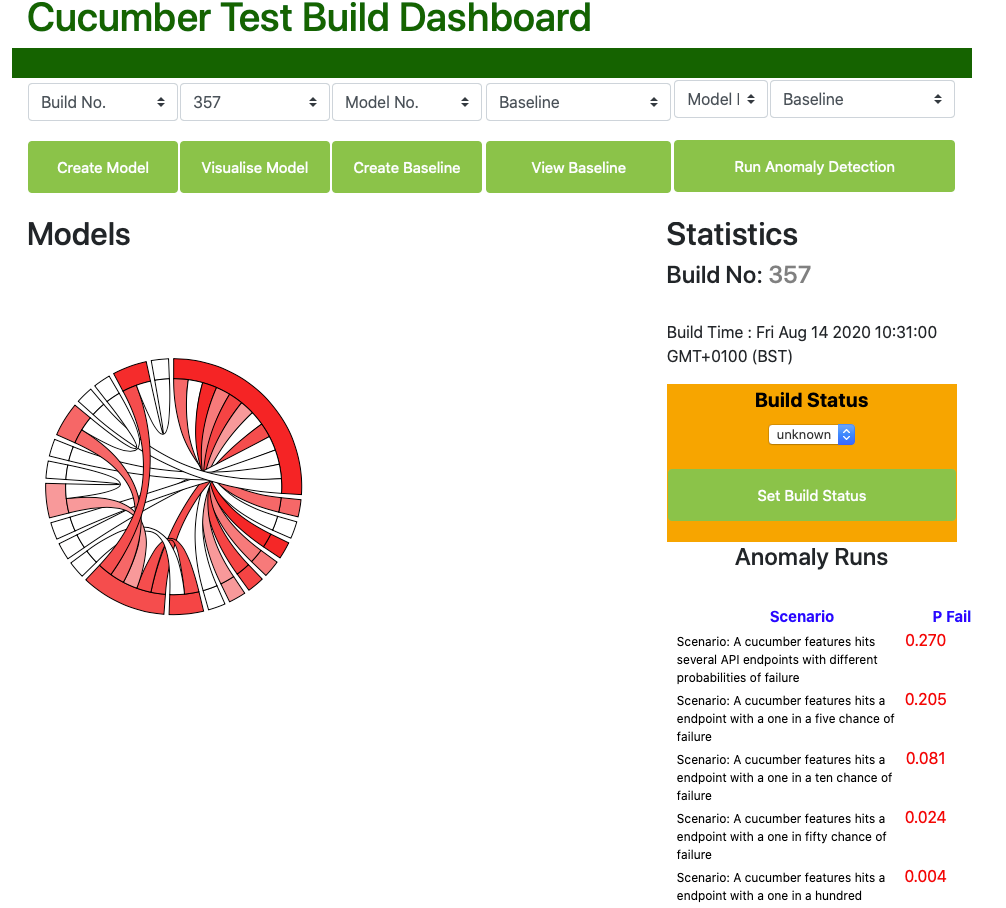
Chord diagram of probabilities of failure
When we first initially visualise the model, a chord diagram is displayed towards the top left of the screen. Each outer segment represents either a BDD scenario or a scenario step, and the inner chords link scenarios to the steps they contain.
The segments are chords range in colour between white and deep red. The more red they are, the higher the probability of failure.
Build Status
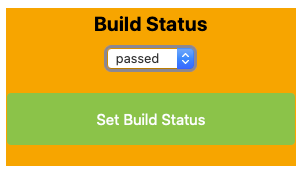
At the top of the right hand sidebar the build status is displayed. We assign the final build status manually, so when a new build is being inspected then the status will be unknown.
Scenario and Step Probabilities
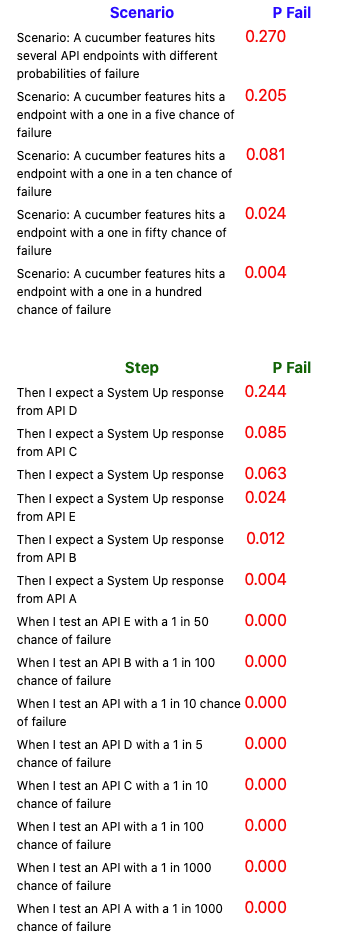
Further down on the right hand side bar are displayed the probabilities of failure for all the scenarios and scenario steps within our test framework for the build whose model we are now inspecting. Note that the probabilities for the scenarios fall quite closely to the probabilities we would expect, suggesting that the modelling is reasonably mathematically robust when running the test framework 250 times. For instance, the actual probability of failure (pFail) for the scenario expected to fail one in 5 times is 0.205, close to the expected figure of 0.20. Likewise pFail for the scenario expected to fail one in 10 times is 0.081, close to our expected figure of 0.1. Of course the lower the frequency of the failures, the more runs of the test framework would be required to return accurate probabilities for them. However very rare intermittent failures are probably of less interest.
Note that the scenarios 'Then' steps have more variable probabilities than the scenarios, as many are used in more than one scenario and therefore have different combinations of failure. The scenario 'When' steps, unsurprisingly as they do not contain test assertions, record very low or non-existent pFail values.
Even without further inspection, we now have a lot of very useful quantified information concerning just how unstable our application is, and where we should prioritise our effects to improve overall application stability.
Inspecting the Chord Diagram
When you click on one of the chords on the chord diagram, then information on the scenario and step is displayed. To the right is a pFail vs. time graph that shows the pFail values for the scenario and step in question in previous builds, assuming that these scenarios and steps were present in builds prior to this one. Individual builds are shown as red for failed builds, green for passed builds and grey for those whose are known. Below are histograms showing the same pFail data for the scenario and step as histogram distributions.

We now have a reasonably heuristic approach that we can use for quickly manually assessing build status.
Modelling Workflow 2: Anomaly Detection
Anomaly detection is a machine learning algorithm, that classically uses the data sets exhibiting normal gaussians distributions in n-dimensional space. For instance, the diagram below shows two features whose gaussian distributions map in 3 dimensional space.

if you are unfamiliar with Anomaly Detection I would strongly recommend Andrew Ng's excellent machine learning course on Coursera, which includes a section on this technique in far more depth than I have here.
Create Baseline - we can create a suitable baseline for anomaly detection by inspecting the gaussian distributions of scenarios and steps. A new build can then be judged according to the baseline and judged normal or anomalous.
When we opt to create baseline, all the histogram distributions for each of the scenarios and steps that were present in our chosen base build are displayed. We can then chose which distributions to use based on the features we would most like to examine and the suitability of their distribution, which should be roughly normal rather than skewed.
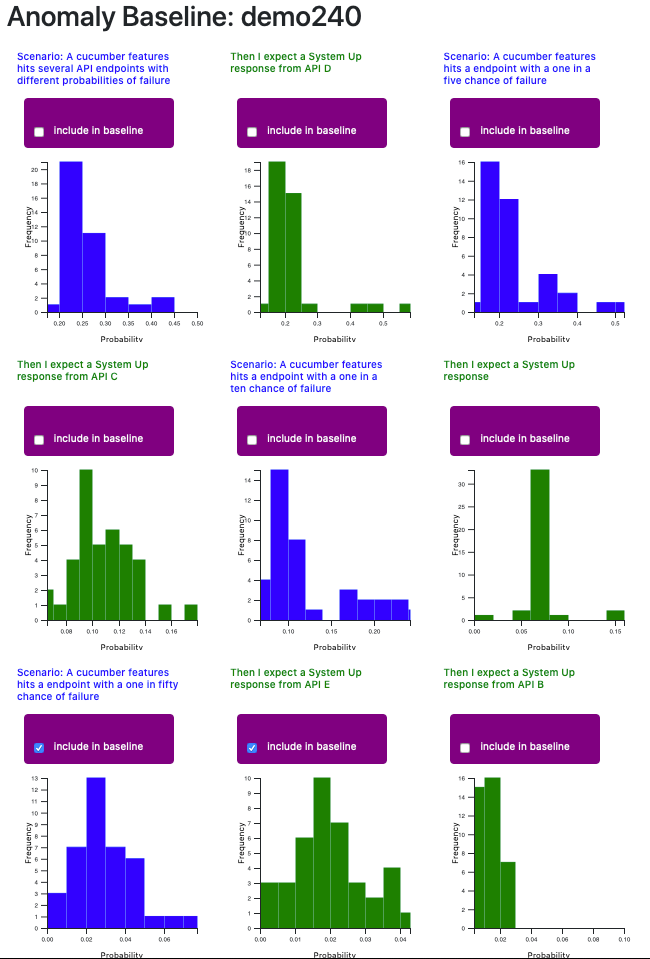
When we check 'include in baseline', all builds present in the histogram distribution will be included by default.
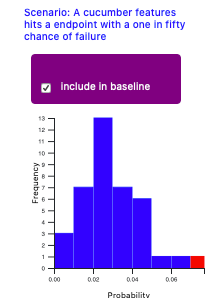
However, we can also tweak our gaussian distribution to exclude individual builds that appear anomalous.
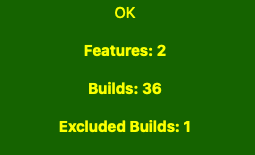
In order to work, anomaly detection creates an n x m matrix. 'n' stands for the number of features (not to be confused with BDD type features). In our case features consist of the scenarios and steps we have chosen to include. 'm' stands for the number of samples, in our case the number previous builds we have in both of our features, minus any we have deliberately chosen to exclude.
In order to work correctly, the anomaly detection algorithm requires that m > n x 10, so in our case having included two features we require at least 20 builds. the dashboard app will show the status of our selection and warn us if we are below the threshold:
This means that even to include, say, ten scenarios and steps would require no less than 100 builds. However, we have seen that Kubernetes jobs running the test framework hundreds of times can be completed within 20 minutes, so one way to bulk up your 'm' number is to run these jobs on a cron basis for a while until you have enough build test runs.
View Baseline - now we have created our baseline, we can view it, although right now that does not show us anything useful.
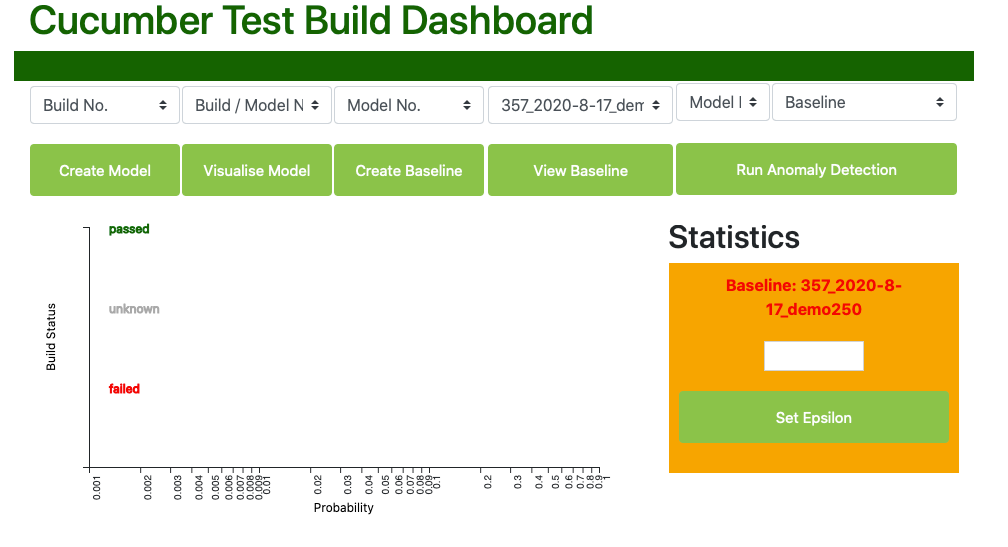
Setting Epsilon: before we can run our target build against our new baseline to see whether or not it is anomalous, we need to set the epsilon property. epsilon is essentially the probability boundary between what we estimate are normal or anomalous builds.
Anomaly detection works by calculating the probability that a new sample (in our case a new build) lies within the normal distributions of each of the sample features. A sample that has a probability higher than the epsilon value is regarded as normal, whereas a value lower than epsilon is regarded as anomalous.
To set the epsilon value, we should first run a number of previously passed and failed builds that we have not included in our baseline (it is of course unlikely you would want to include known failed builds in your baseline) and map the probabilities.
Run Anomaly Detection - to run anomaly detection, we simply use the right hand top select boxes to choose the build and the baseline we wish to use. For convenience, the statuses of previous builds are included in the select options. In this case we want to run the previously a series of previously passed and failed builds against the newly created 'demo_240' baseline.
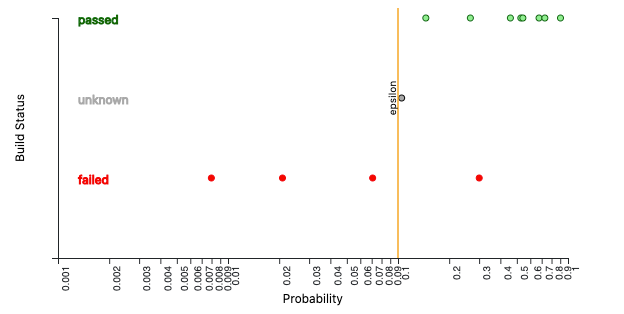
View Baseline (again) - now when we view the baseline information again, we can see the probabilities that each of these builds have of being within the normal distributions of the baseline:
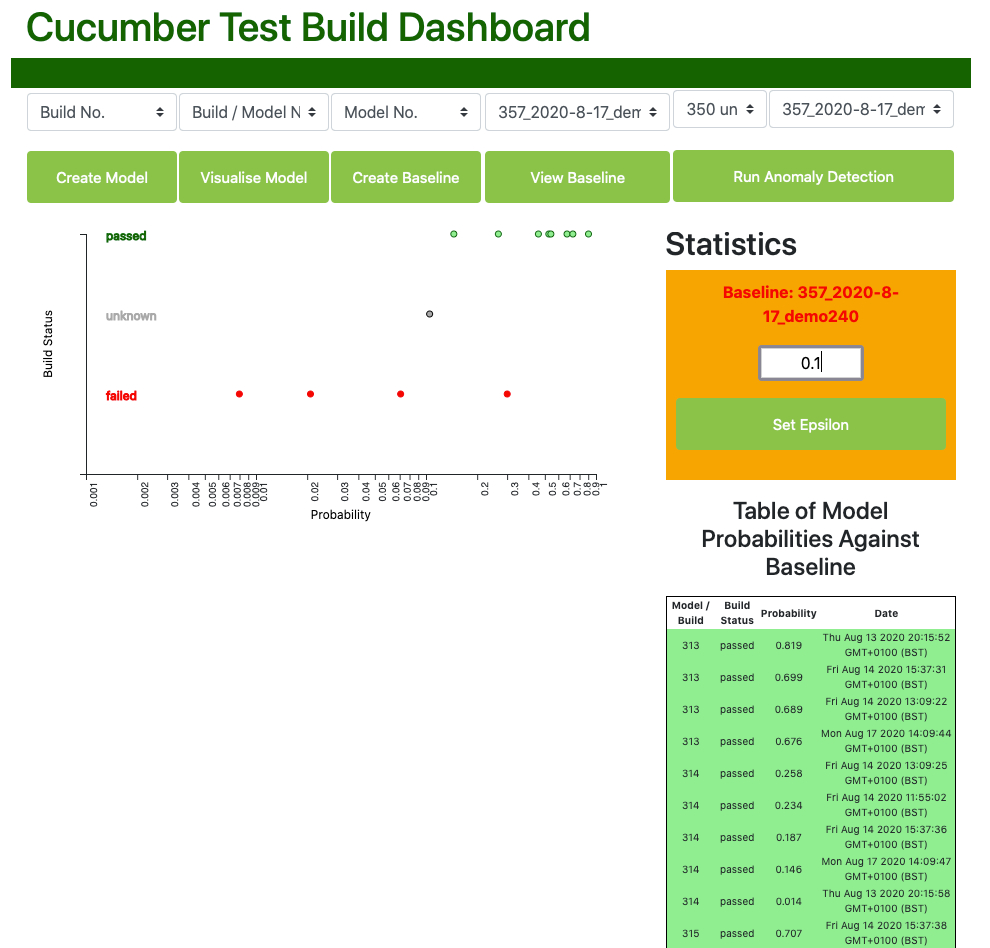
We can see here that most of the previously passed builds have a high probability of belonging to the distributions found in our baseline features, whereas the failed builds (in red), have generally very low probabilities of doing so, mapping with one exception far to the left. An unknown build lies pretty much in the middle.
On this basis, we can now set an epsilon value - let us set it in this case to 0.1.
The epsilon value now appears on our graph:
Run Anomaly Detection On A New Target Build: having now calculated the epsilon value, we can use our baseline against any new builds we want to detect for anomalies:
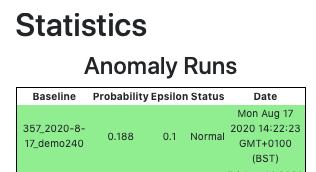
Hurrah! Our new build seems normal. We can then use this information to set the status for this build:
Conclusion
We have shown that using the power of cloud computing and simple statistical modelling we can cope with instabilities in our application builds.
Specifically:
- Running our test framework aginst our target application build on a kubernetes cluster can generate hundreds of test runs against a given application artefact within a perfectly acceptable time frame.
- Probability calculations (pFail) can give us heuristics regarding build status and given us a quantitative understanding of the overall instabilities in our build process.
- Visualising the pFail values for previous builds let us understand the changing patterns of fallure over time.
- We can use pFail calculations to understand whether our current build instabilities are acceptable or to set metrics for future improvement.
- We can use advanced anomaly detection techniques to flag builds as being potentially anomalous compared to baselines we have created using previous builds.
This means:
- The causes and severity of build instabilities are potentially much better understood.
- Refactoring efforts can be much better targeted.
- Builds can be passed with greater confidence.
- Targets for greater application stability can be set and reported back to the business.
- The build pipeline is much less likely to require re-running.
- The build pipeline is more likely to be maintained by the team.
- Flickering scenarios are much less likely to be deleted.
- Considerably higher morale and team productivity
Summary And Further Work
I hope you found this proof of concept useful. I believe that the savings in team productivity from this approach are potentially huge.
It should be easy to add further automation and integration - for example automatic running of anomaly detection and creating pass / fail algorithms for builds - for use in standard Jenkins pipelines with minimal human intervention.
If you have any projects you think this approach could benefit then please contact me via LinkedIn.
I hope at some future stage to release the code for this as a Github project and perhaps a turn key application. However I will only do either if the demand is there for either, so please do get in touch if you are interested.